Looking for a Guide on the Full Profile Tool Instead?
This page is a Guide to the Light Version of the Profile Tool. The Full GOAL Modelling Profile Tool that features in the Enhanced and Advanced Tiers includes twice-weekly updates, a Personal Betting Log, and much more. The how-to guide for the full version of this tool is available here:
An Introduction to the Profile Tool (Light Version)
The Goal Modelling Profile Tool is designed to provide detailed statistical analysis of football fixtures across multiple leagues, helping users identify betting opportunities. The tool provides a summary of the home team and away team performance.
The light version is a slimmed-down replica of the application that will be available across all major leagues. It provides a gateway for interested parties to familiarise themselves with the tool before taking the next step in their GOAL Modelling journey.
The application will be updated with fixtures and market prices for the midweek fixtures on a Tuesday and the weekend fixtures on Friday.
This page outlines the usage and functionality of the tool step-by-step.
How to Use This Guide
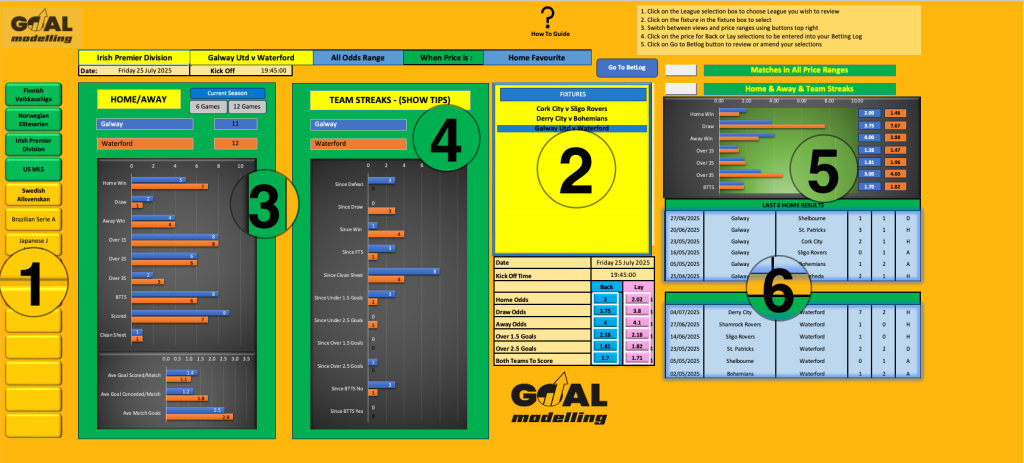
Below is ‘Map’ of the Profile Tool (Light Version) with each function and part of the model labelled numerically with a key to the right. Click on the section within the key to jump to the relevant section of the How-To Guide. At the bottom of each section is a button which will take you back to this Map allowing you to explore the entirety of the Model step-by-step without losing your place.
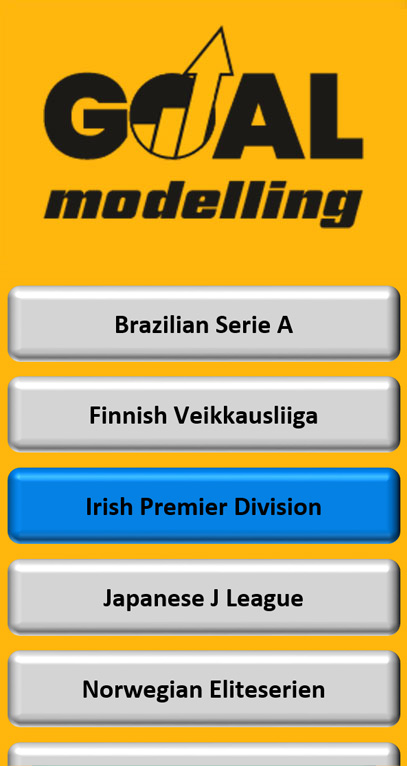
Within the light version of the Profile Tool, only one league will be available to analyse per model, this will be shown in blue on the left hand side of the Tool. On a model with multiple leagues available, click on the league for which you’d like the data.
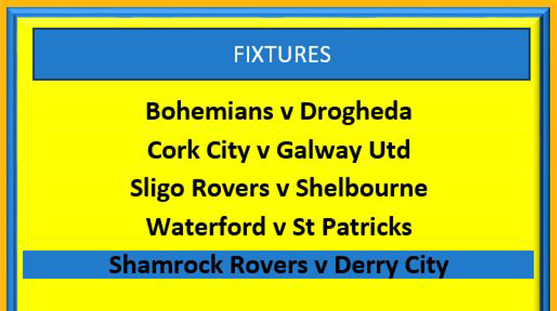
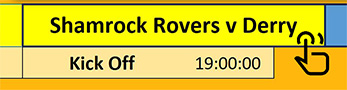
With a league selected (here, the Irish Premier Division), the fixtures for the current period will display in the fixtures box. Click on the fixture you wish to analyse.
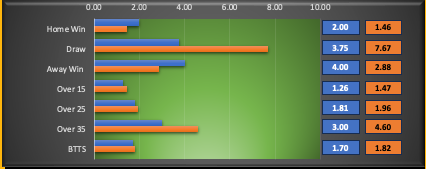
Once a fixture is selected, the top information bar will update with the League, Fixture, and Price Bracket pertaining to the fixture
The Price Brackets are separated into four categories ranging from Strong Home Favourite (Odds ≤ 1.7) throught to Away Favourite.
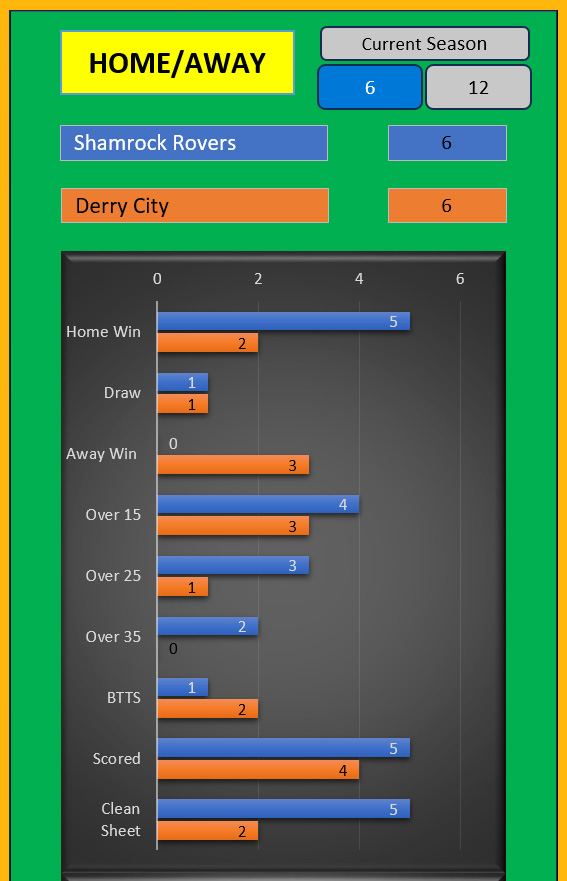
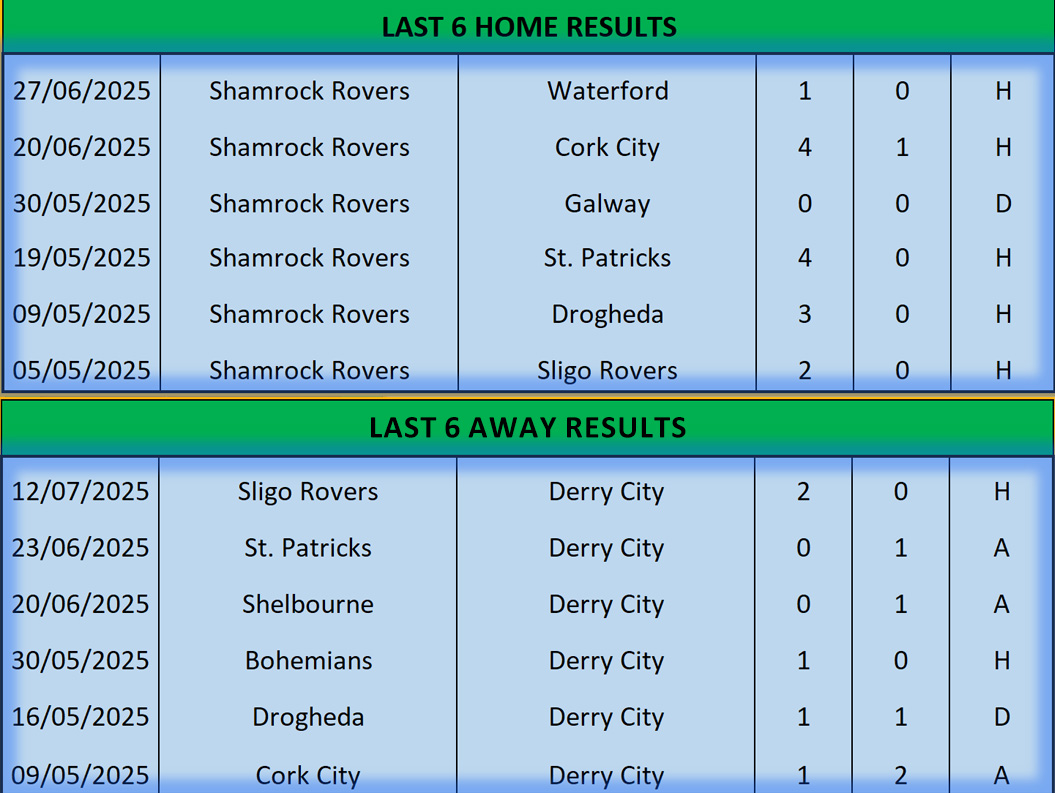
On the Home/Away Chart, choose from Current Season, Last 6 Games, or Last 12 Games
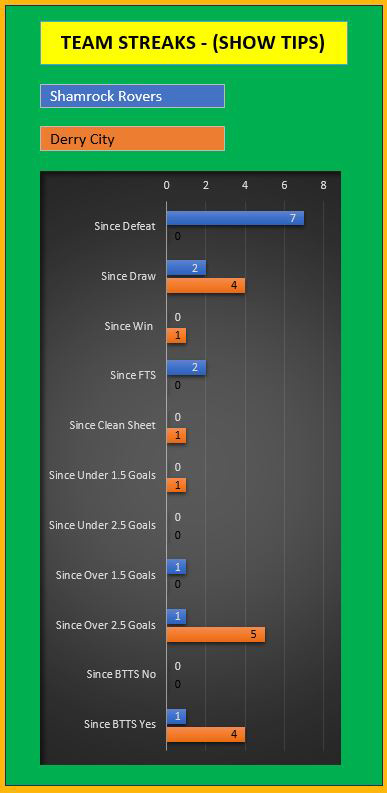
All the relevant data for the selected period will be displayed with Home Team in blue and the Away team in orange.
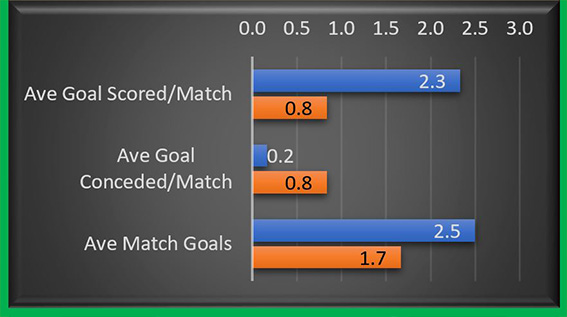
The lower section of the Home/Away Chart contains data on the average amount of goals scored by the Home & Away Teams in the period selected.
Average Goals Scored/Match: Average goals scored per match for the Home Team at Home (blue) and the Away Team when Away (orange).
Average Goals Conceded: Average goals conceded per match for the Home Team at Home (blue) and the Away Team when Away (orange).
Average Match Goals: The average number of total goals per match when the Home Team is playing Home (blue) and separately when the Away Team is playing Away (orange).
Important Note: This tool is intended to support deep analysis and informed decision-making. Users are encouraged to validate trends manually and not rely solely on algorithmic outputs or tip suggestions.